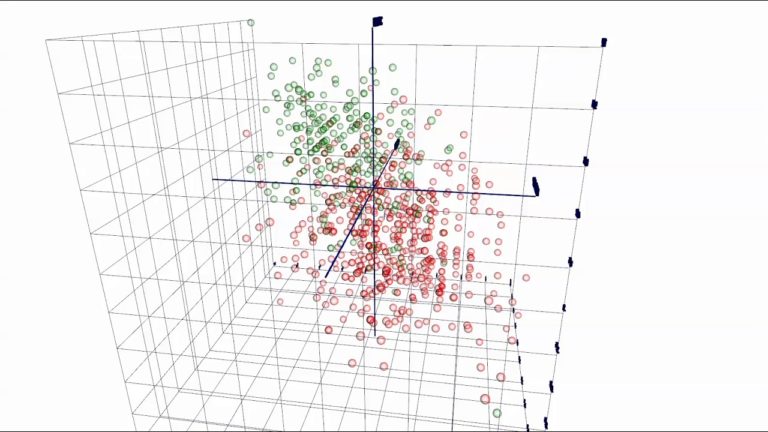
This video shows an interactive 3D plot of statistical values calculated from a multi-channel data acquisition system. The graph supports standard zoom, pan, and rotate controls, as well as multiple visual styles.
The visualization software and data acquisition system were both engineered by Martin Company.
Are you interested in working with us as a customer, vendor, or employee? Please tell us about your electronics engineering or production requirements, or send us a brochure or résumé to start the process. Contact us
All rights reserved. Copyright 2024 by Martin Company, Electronics Engineering and Manufacturing.
Trademark Acknowledgement, Privacy Policy, Terms of Use