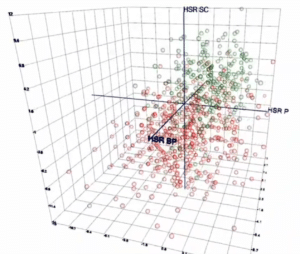
3D Rotating Plot
https://www.youtube.com/watch?v=MW9GUXif0Cc This video shows an interactive 3D plot of statistical values calculated from a multi-channel data acquisition system. The graph supports standard zoom, pan, and rotate controls, as well as multiple visual styles.


